Manual Measurement of Diffraction Disc Shift
Tip
Using the gold_particle_06 dataset from the 4D-Explorer test dataset as an example.
In the left panel, find the 4D-STEM dataset you want to align, right-click, and select Calibration -> Diffraction Alignment from the menu. In the opened page, the default method is manual measurement.
Before starting the manual measurement, you can make some preparations. At the top right of the page, switch to the Displaying Effects tab. In the Auxiliary Circle section, you can adjust the radius and center position of the circle. It is recommended to adjust the radius to match the size of the bright field diffraction disc. Be sure to check the Show auxiliary circle box.
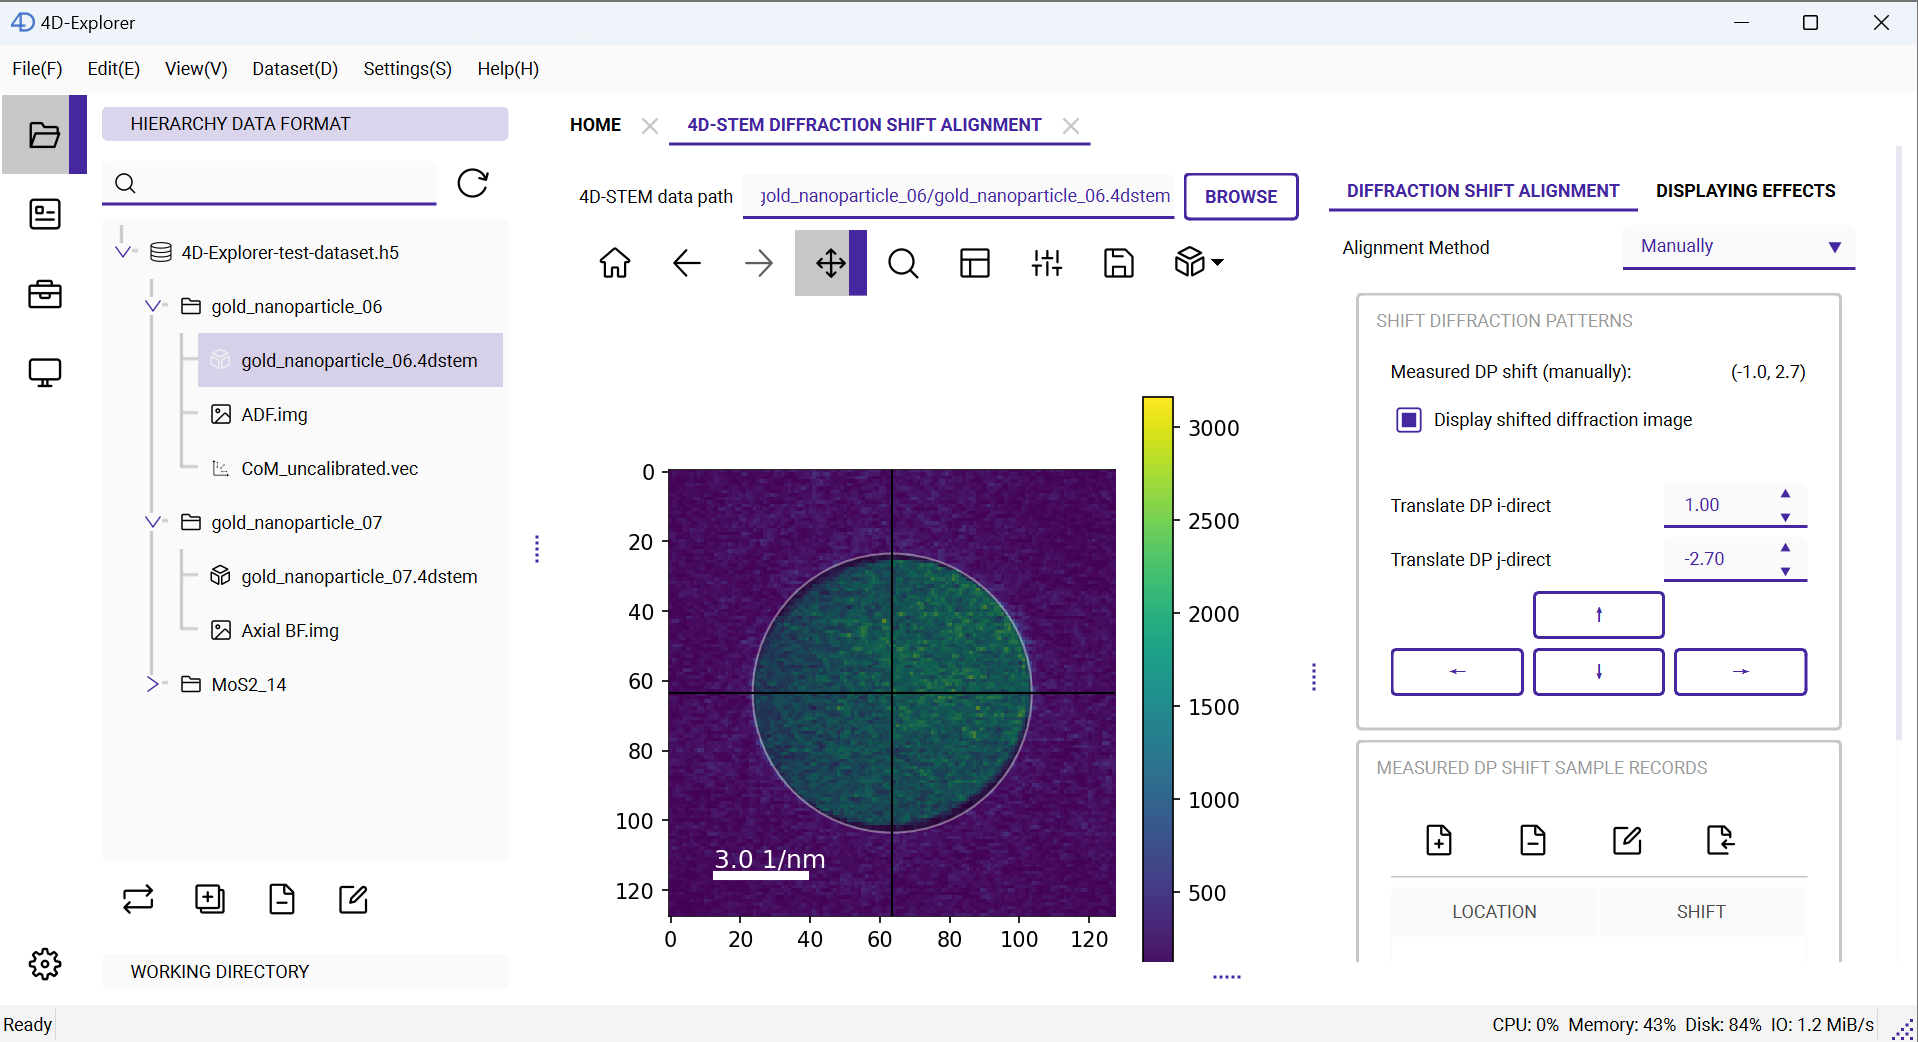
Next, switch back to the Diffraction Shift Alignment tab at the top right. First, for the scan position (0, 0), set the translation in the i direction to 1 and the translation in the j direction to -2.7 to move the diffraction disc to the exact center of the image. Below, in the lower-right portion, there is a table where you can record the measured shifts at different positions. Above the table, there are four buttons: Add, Delete, Modify, and Import. Here, click the Add button, and a new entry is added to the table with Location as (0, 0) and Shift as (-1.0, 2.7).
Note
When a translation includes decimal values, the diffraction image might appear blurred due to interpolation required for subpixel shifts. While the diffraction disc may look blurred, this interpolation generally does not significantly affect the final reconstruction results.
Next, move to the four corners of the scan range, namely (255, 0), (0, 255), and (255, 255), and repeat the process above to record the shifts. If at (255, 255), the diffraction image shows strong multiple scattering effects and is unsuitable for measurement, you can use a nearby scan position, such as (253, 254), instead. Additionally, you can select more scan points, especially ones evenly distributed within the scan range, and measure the corresponding shifts of the bright field diffraction disc.

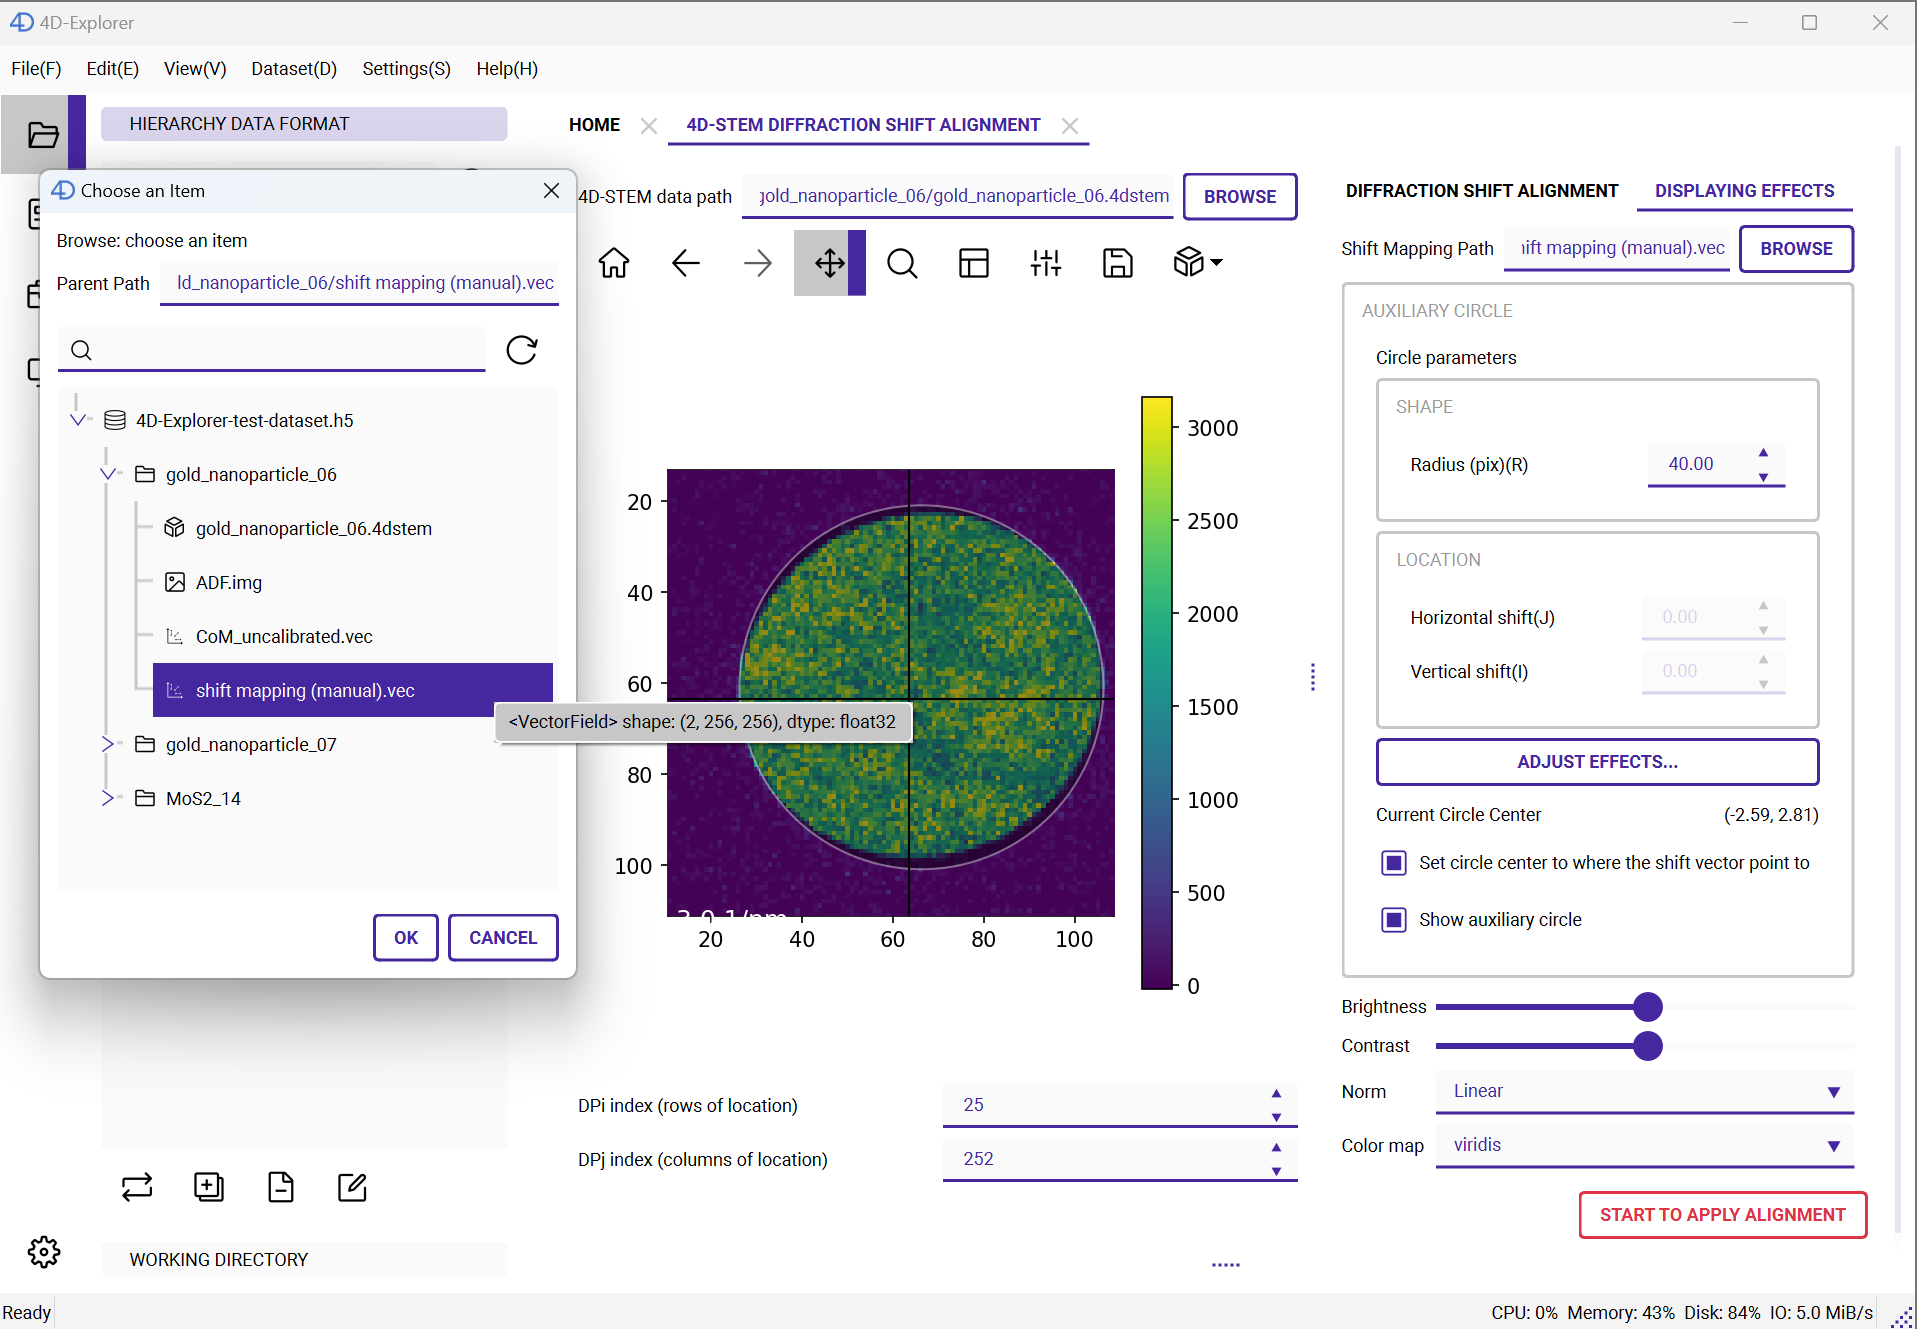
After completing the measurements, click the Generate Shift Mapping button at the bottom, which will open a dialog where you can choose a method to generate the shift distribution. Here, we select Linear Regression. Click Confirm, then choose the dataset path and name to save the results.
Once the shift distribution is generated, you can switch back to the Displaying Effects tab at the top right. In the Shift Mapping Path section, select the newly generated shift distribution. Now, in the Auxiliary Circle section, the Set circle to where the shift vector points to option becomes available. Check this option, and you will see that the circle’s center is set to the position indicated by the measured shift distribution. As you adjust the scan position, you can observe the auxiliary circle moving along with the diffraction disc, allowing you to verify whether the shift distribution is correct. This effect is more noticeable when you use the mouse wheel to adjust the scan position.
Note
When viewing the effect of the shift distribution using the auxiliary circle, be sure to return to the Diffraction Alignment interface and uncheck Display shifted diffraction image to reset the diffraction disc to its original unshifted state.
In the image, the diffraction disc is clearly offset from the center, and the auxiliary circle is set to the measured shift distribution, making its center also offset from the image center and coinciding with the center of the diffraction disc.
Once the shift distribution is confirmed to be accurate, click the red Start to apply alignment button at the bottom of the page. After selecting the output dataset path and entering a name, click OK to complete the process.